Soil holds more carbon than all of the trees in Massachusetts’ forests. Yet until recently, planners and land managers didn’t have a reliable way to see how much carbon was stored in any given piece of land, or what a change in land use would cost or benefit in carbon terms.
That’s the gap the SOCMA project set out to close.
What Is SOCMA?
SOCMA — Soil Organic Carbon Mapping in Massachusetts — is a set of high-resolution data layers developed by Regenerative Design Group that estimates soil organic carbon for every square meter of the Commonwealth. The project was funded by a Healthy Soils Challenge Grant from the Massachusetts Executive Office of Energy and Environmental Affairs (EEA), and grew directly out of the Massachusetts Healthy Soils Action Plan, which RDG helped develop starting in 2019.
As RDG’s Bas Gutwein puts it, “What we were trying to solve is the question of our impact.” If Massachusetts wants to meet its climate commitments, the state needs to account for where carbon is coming from and going. Soil is the largest terrestrial carbon reservoir. According to the project’s final report, Massachusetts soils store approximately 425 million metric tons of carbon across the full soil profile. That’s equivalent to 175 billion gallons of gasoline (Greenhouse Gas Equivalencies Calculator).
The Problem with Existing Data
The challenge was that existing data didn’t connect soil type to land cover in a way that made carbon accounting possible. The USDA’s soil survey database, the best available source of soil information, typically provides carbon estimates for only one land use per soil mapping unit. When that data is laid over actual land cover, however, each mapping unit in Massachusetts contains an average of twelve different land uses. A forested soil behaves very differently from the same soil under a parking lot, a farm field, or a lawn.
According to Bas, “We had soil carbon data. We had high-resolution land cover data. But they were not integrated.”
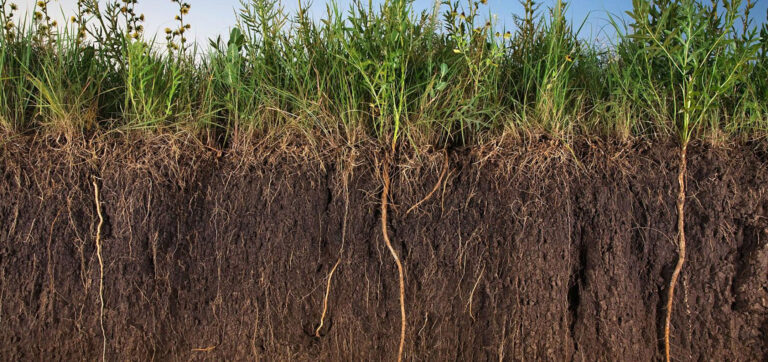
To understand why that integration matters, it helps to think about how soil carbon actually works. Bas explains it this way: “It helps to think about the carbon stocks in the soils as a bathtub full of water. Plants are basically pulling carbon from the atmosphere and putting it into the soil. That’s the faucet. And then we have all these little organisms inside the soil that are breaking that carbon down and releasing it back into the atmosphere. Those are the drain in our bathtub.”
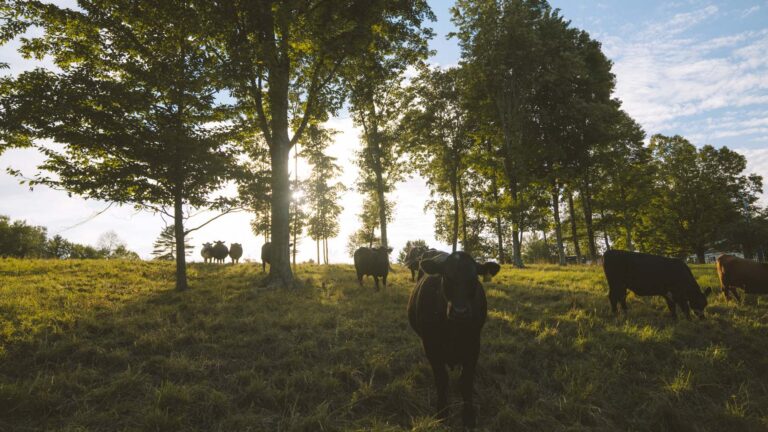
When forests are cleared, the faucet turns way down. Grasses and shrubs don’t pump carbon into the soil the way trees do, but the drain keeps running at the same rate. The soil slowly reaches a new, lower equilibrium. According to the project report, converting forest to development results in a 62% loss of soil carbon in the top meter. On an acre of typical soil that is 40 metric tons of carbon, which is equivalent to 373,495 miles of driving in a typical car. Converting pasture to forest, on the other hand, increases it by 79%, potentially offsetting 280,122 miles of driving.
Those losses and gains vary significantly depending on the soil. A sandy upland soil and a deep wetland soil are not remotely comparable, which is exactly why a one-size estimate for each soil type wasn’t sufficient.
Similarity Over Proximity
To fill the gaps in existing data, the team developed a method for finding the most appropriate carbon estimate for each soil-and-land-cover combination; not by looking at nearby soils, but by looking for the most similar ones, wherever they happened to be.
“Instead of looking for proximity in space, we look for proximity in soil characteristics,” Rafter Ferguson explains. “Even if it’s further away, we look for the most similar soil rather than the closest.”
The distinction matters because, as Bas put it, “soils are not something that has a strong boundary. Soils are a gradient.” Two adjacent areas can behave very differently, while two soils miles apart may share nearly identical properties. Matching by soil characteristics, including texture, drainage, and parent material, produces more reliable estimates than matching by location alone. The team worked closely with soil scientists at the USDA’s Natural Resources Conservation Service (NRCS), whose input helped shape this approach.
Data Tools and Revelations
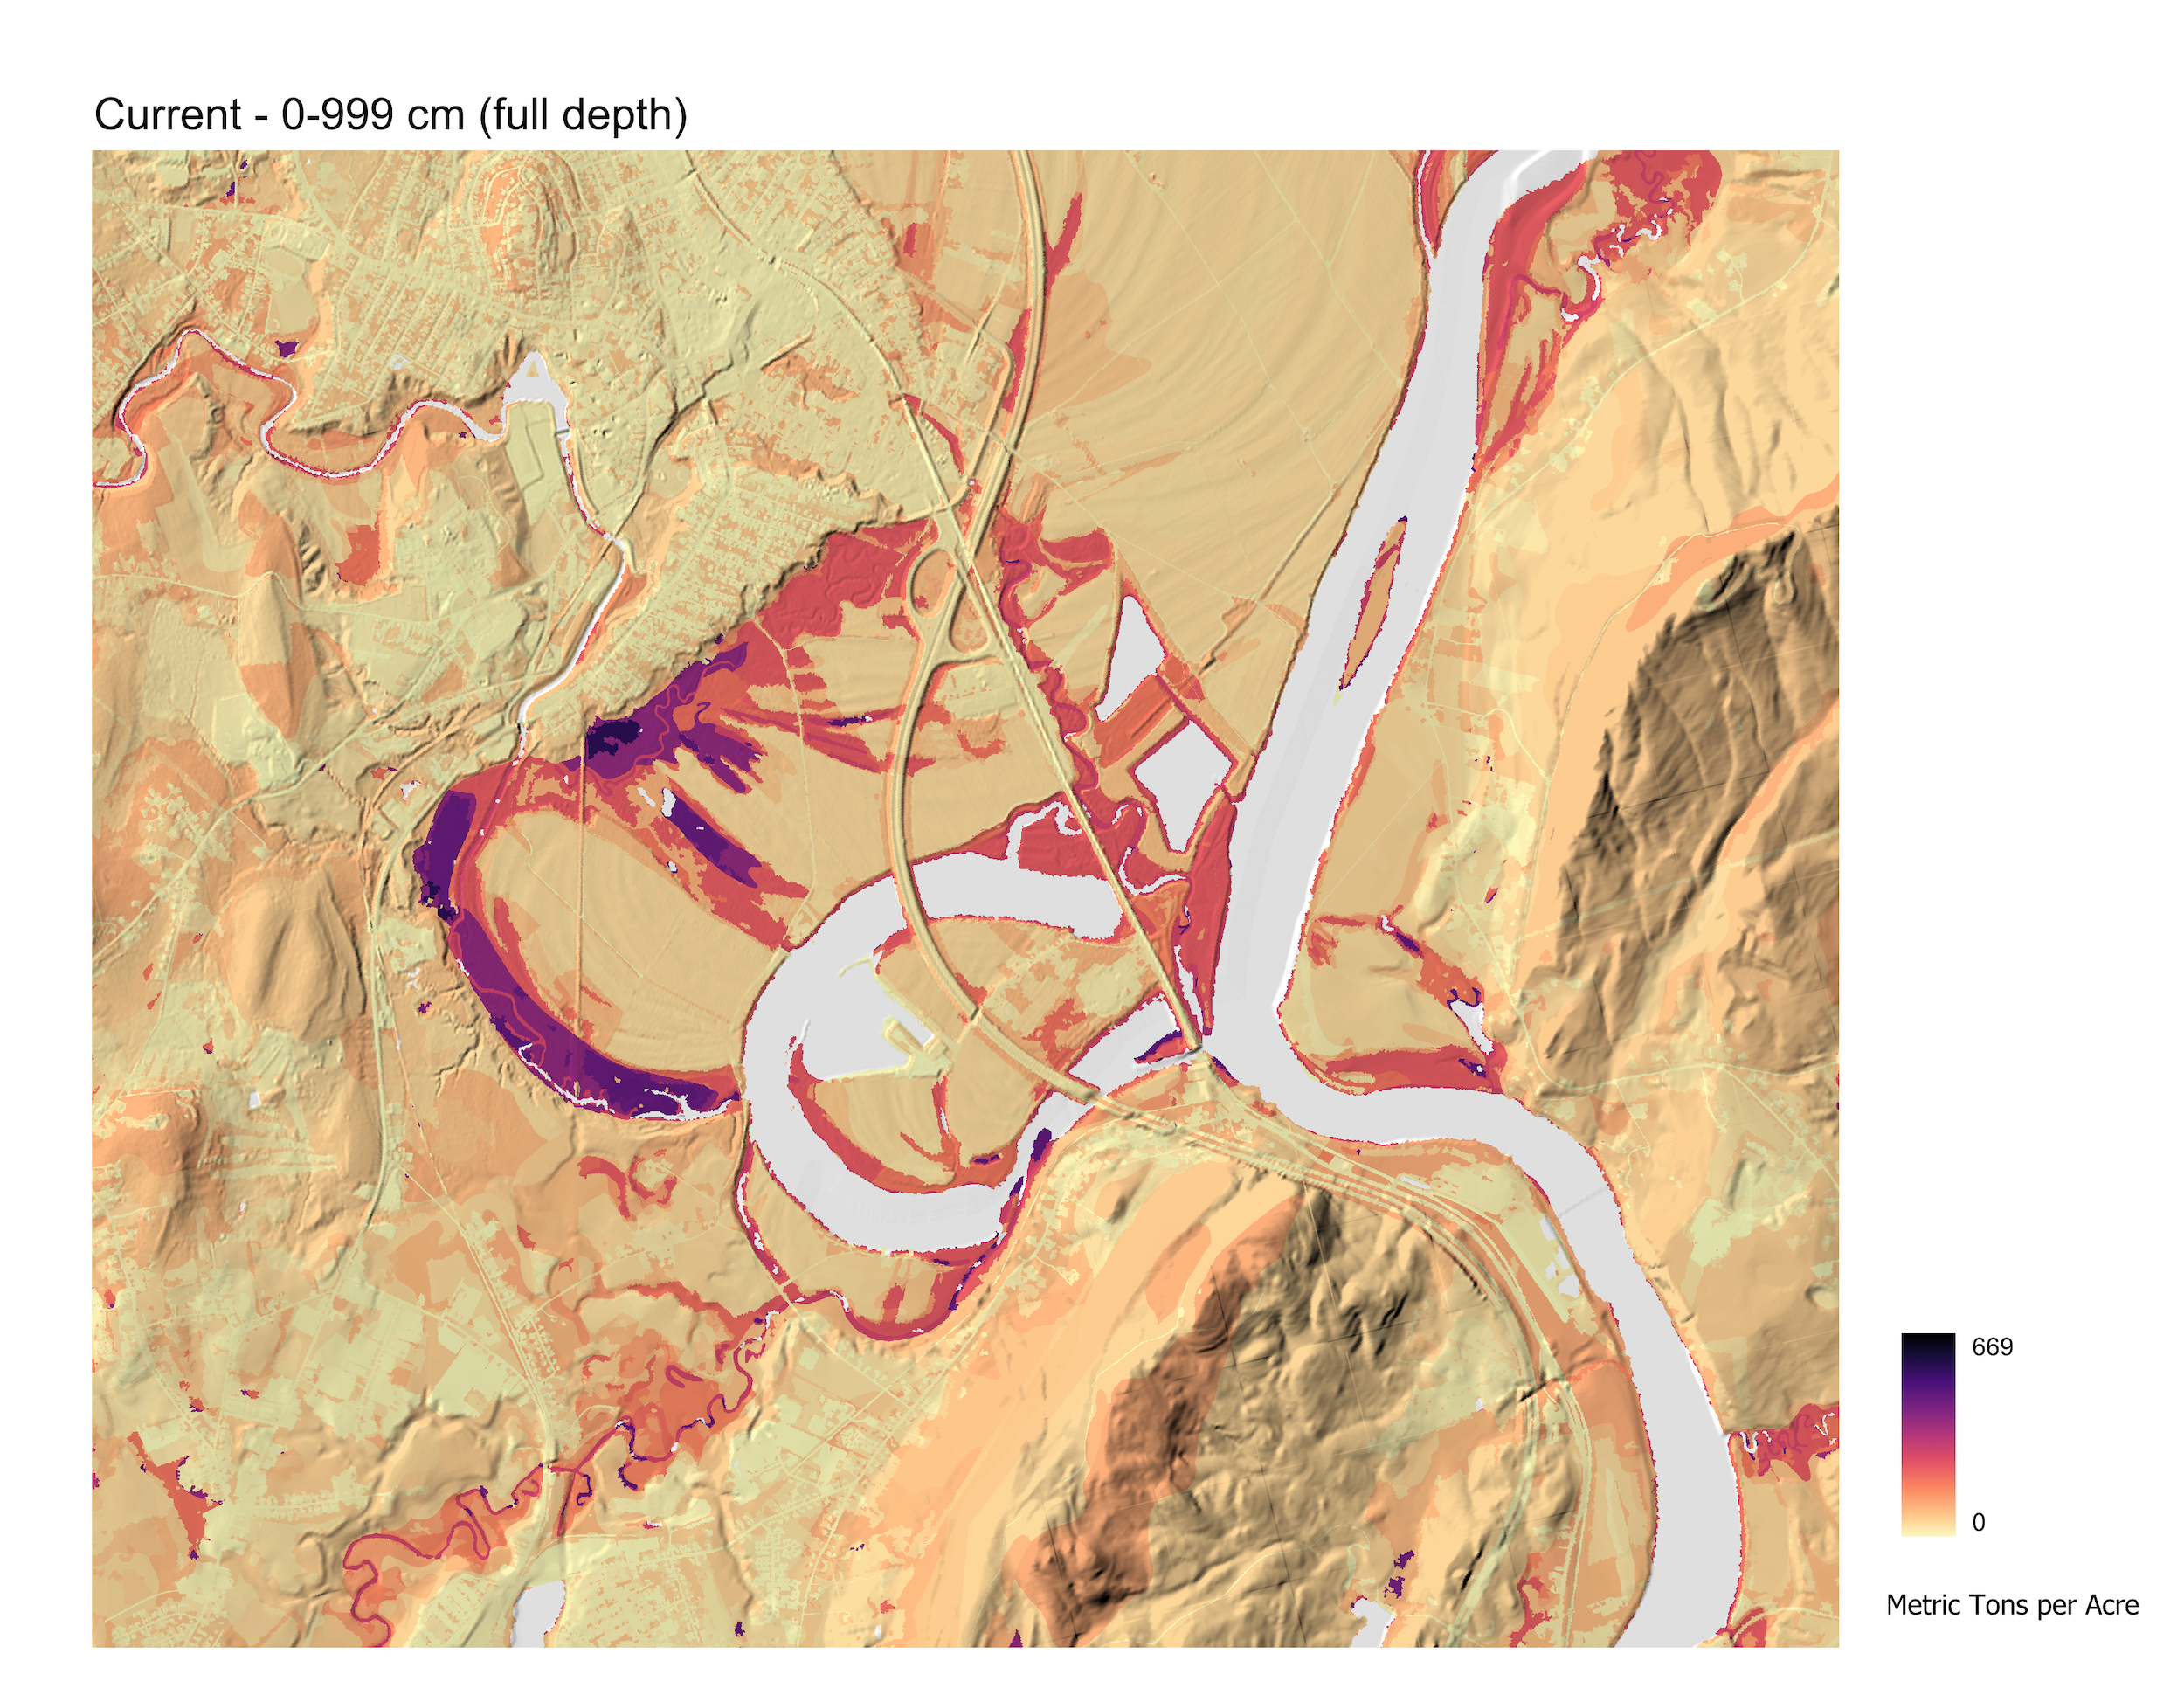
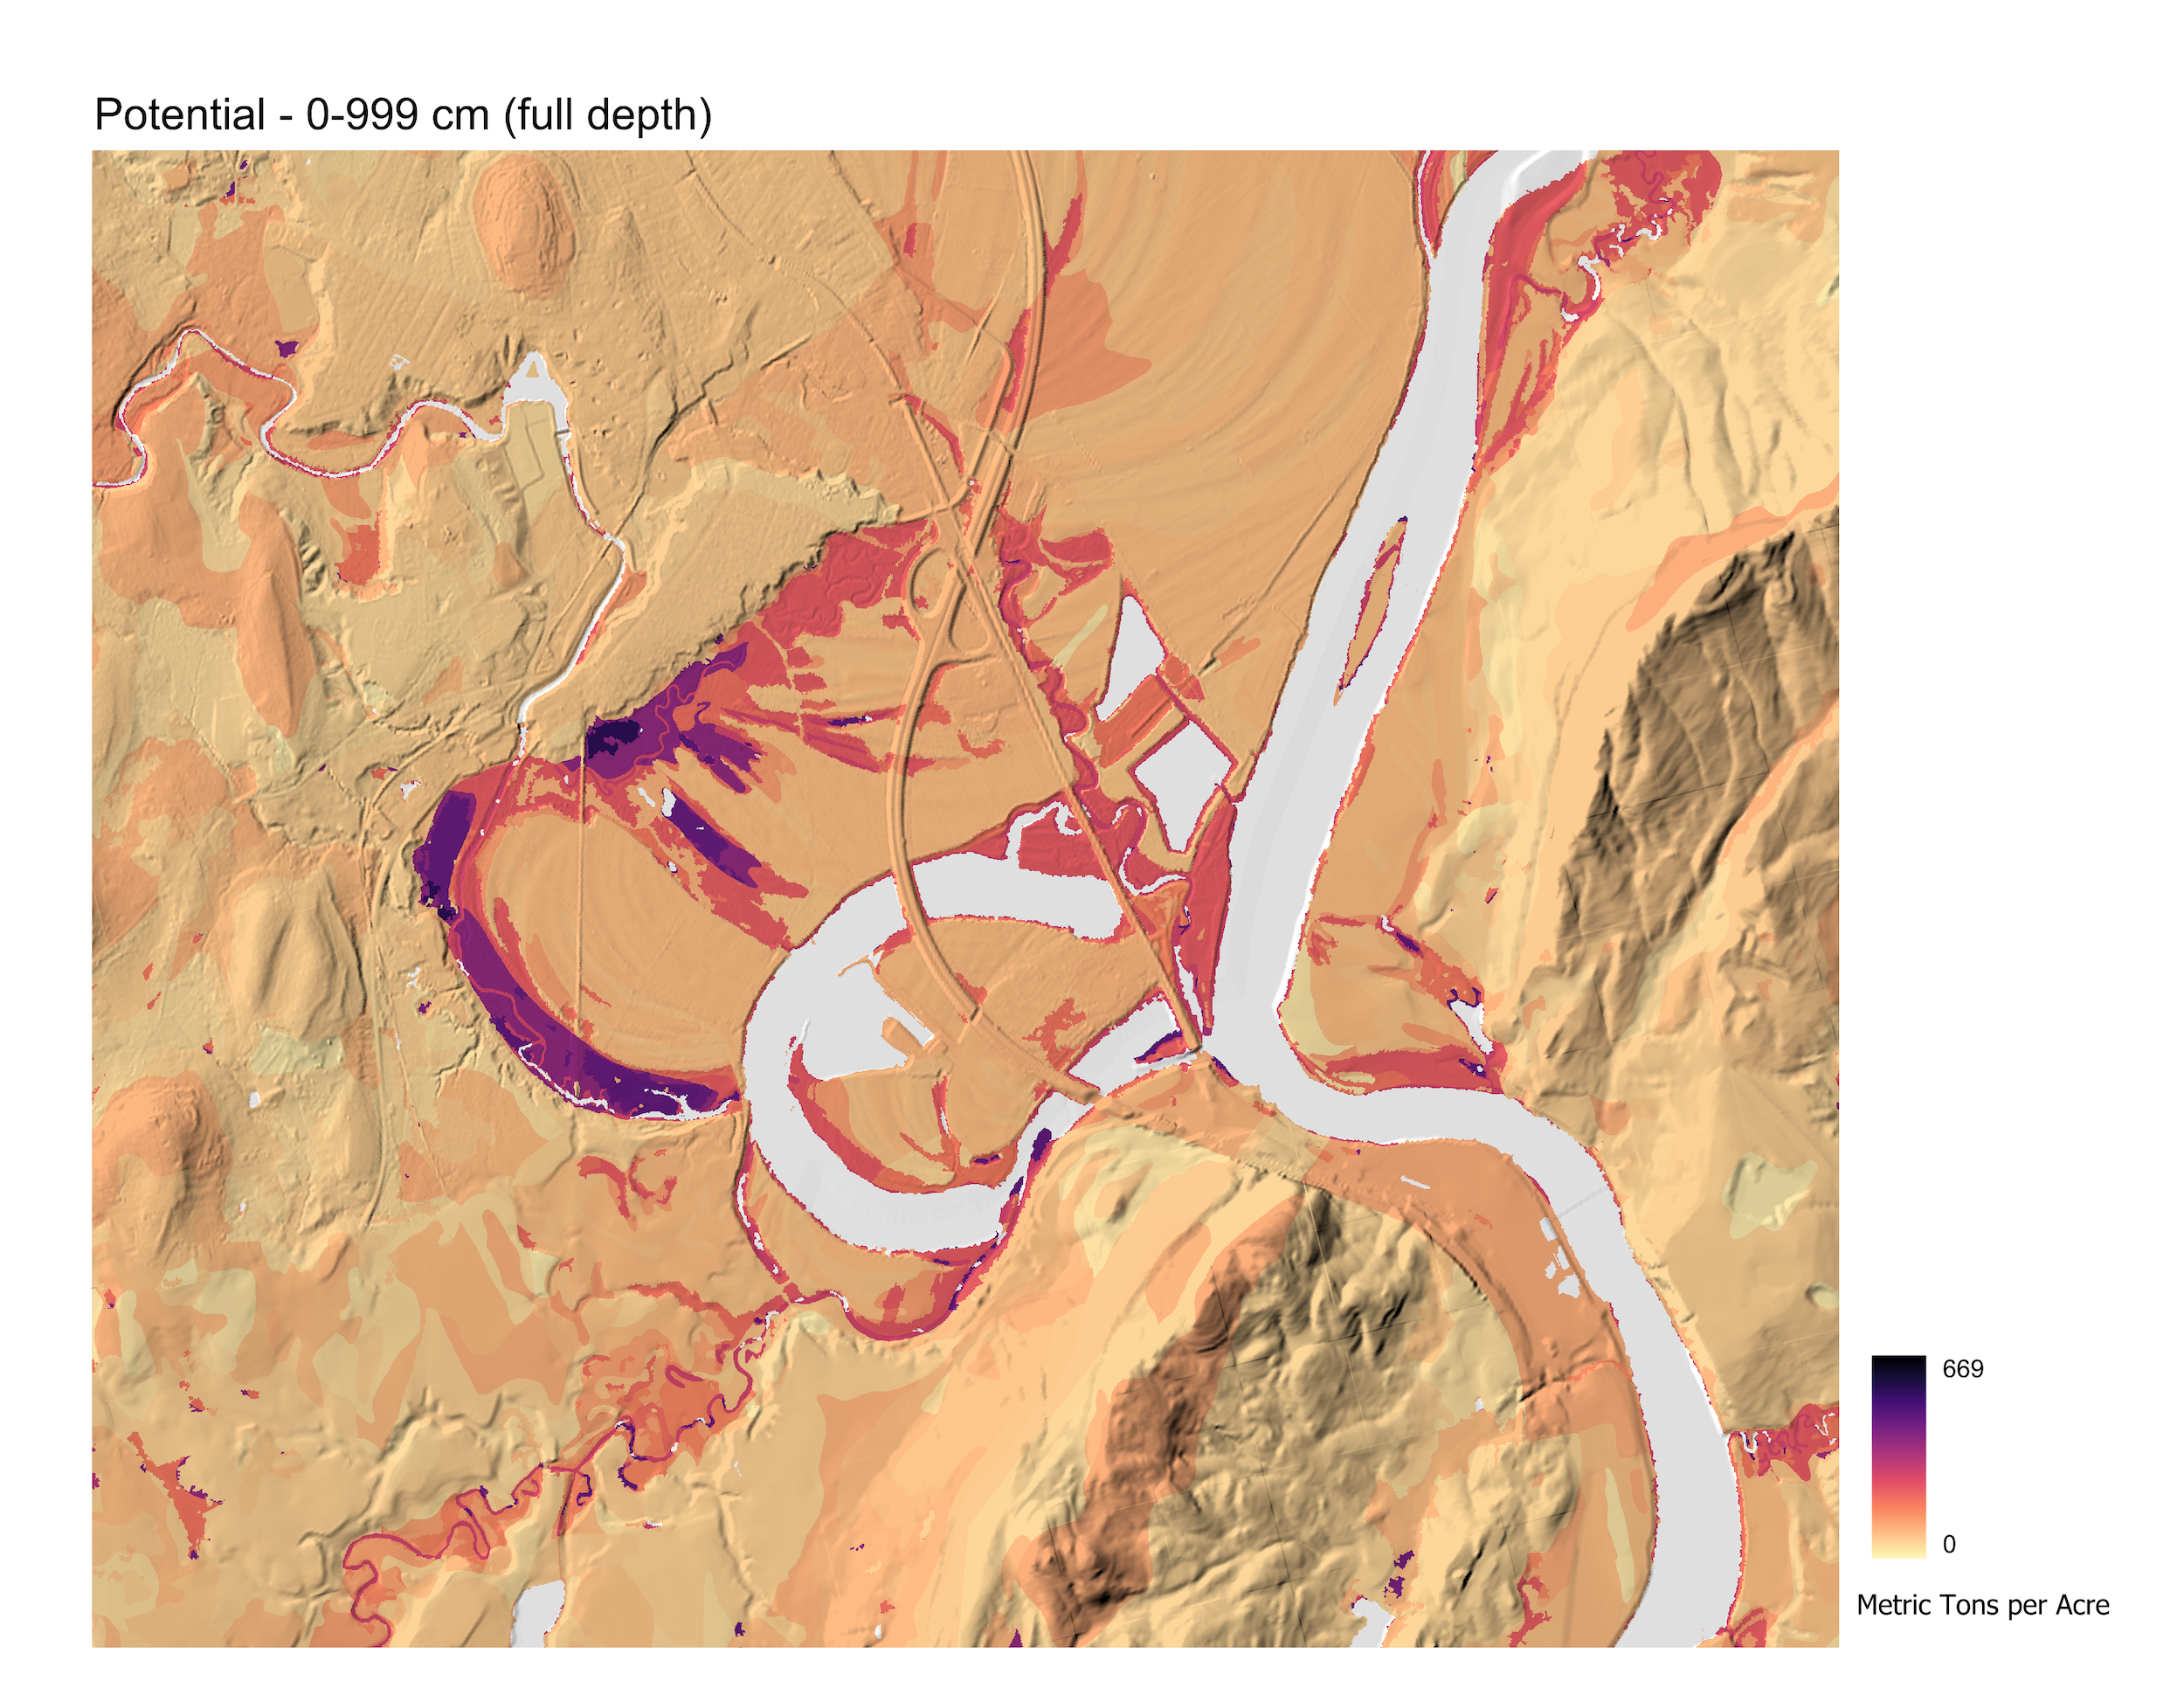
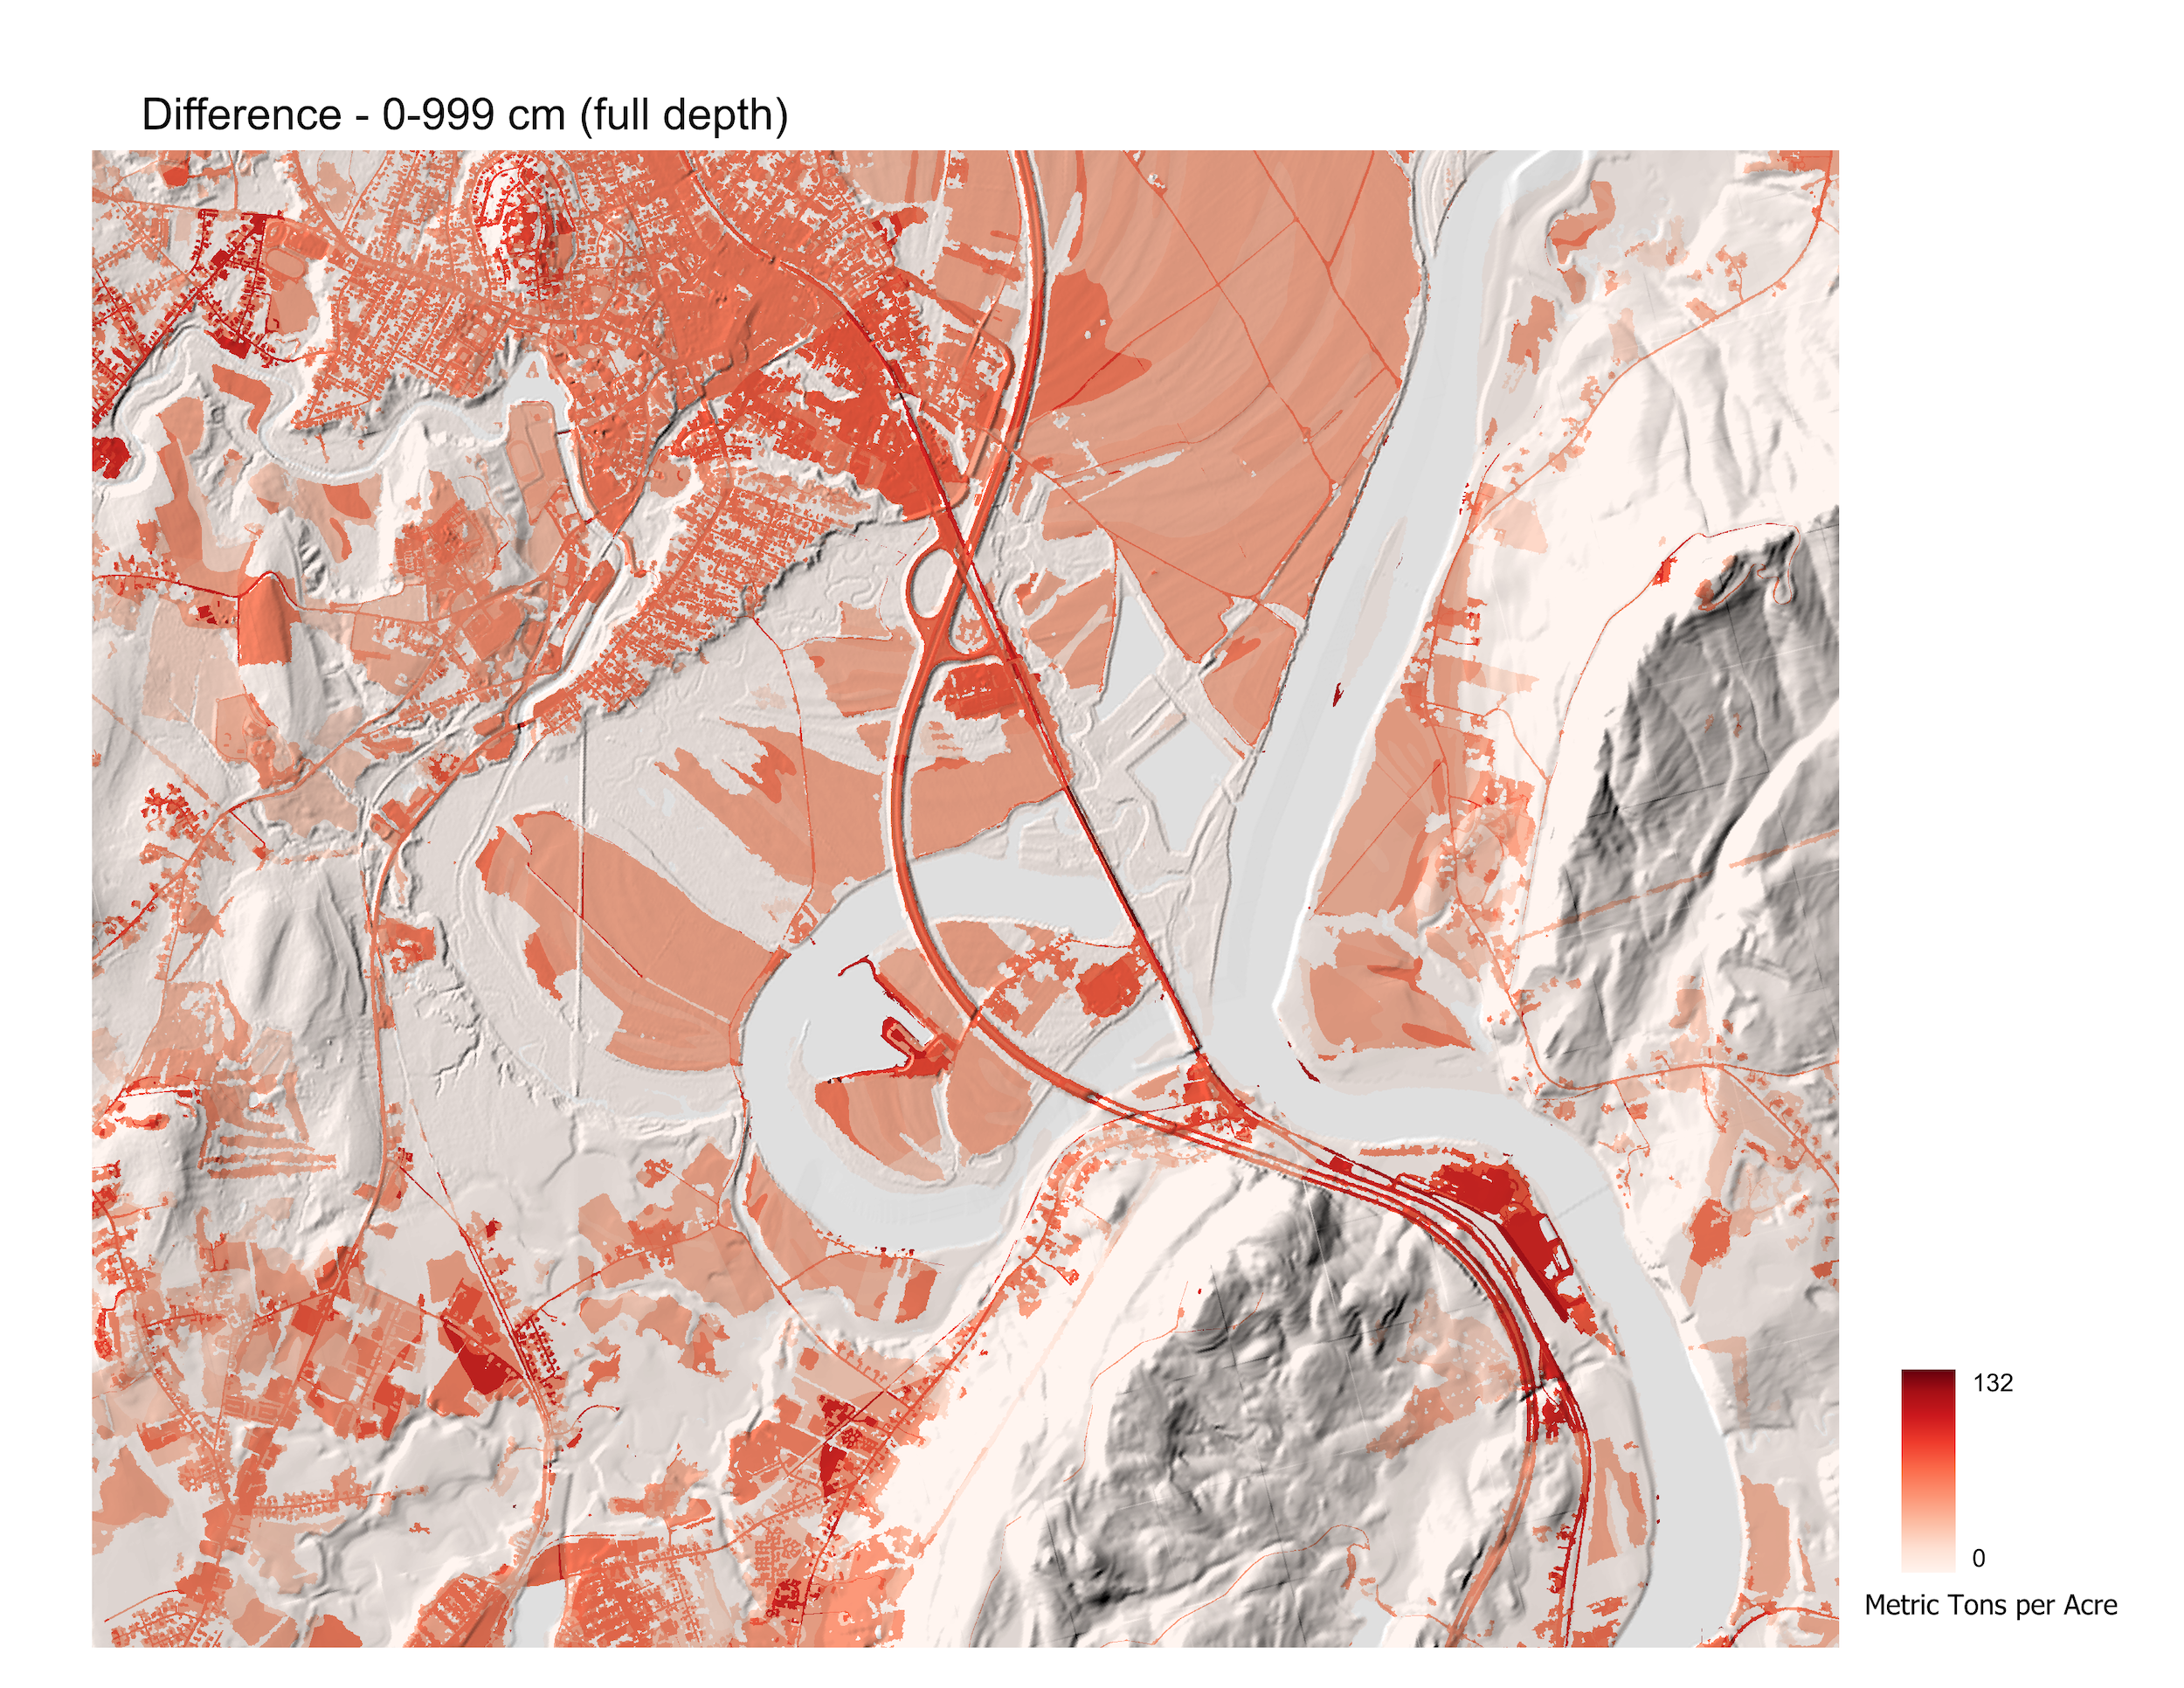
The project delivers three main tools. The current data layers show estimated soil carbon under 2016 land cover conditions at three depths: 0–30 centimeters, 0–100 centimeters, and the full soil profile. The potential layers show what each soil could store if upland areas were forested, the land use associated with the highest carbon storage for most soils. The difference between the two is, in effect, a picture of where carbon has been lost and where it might be rebuilt.
A third deliverable, a land cover conversion table, gives planners quantified estimates of carbon gain or loss when land changes from one use to another.
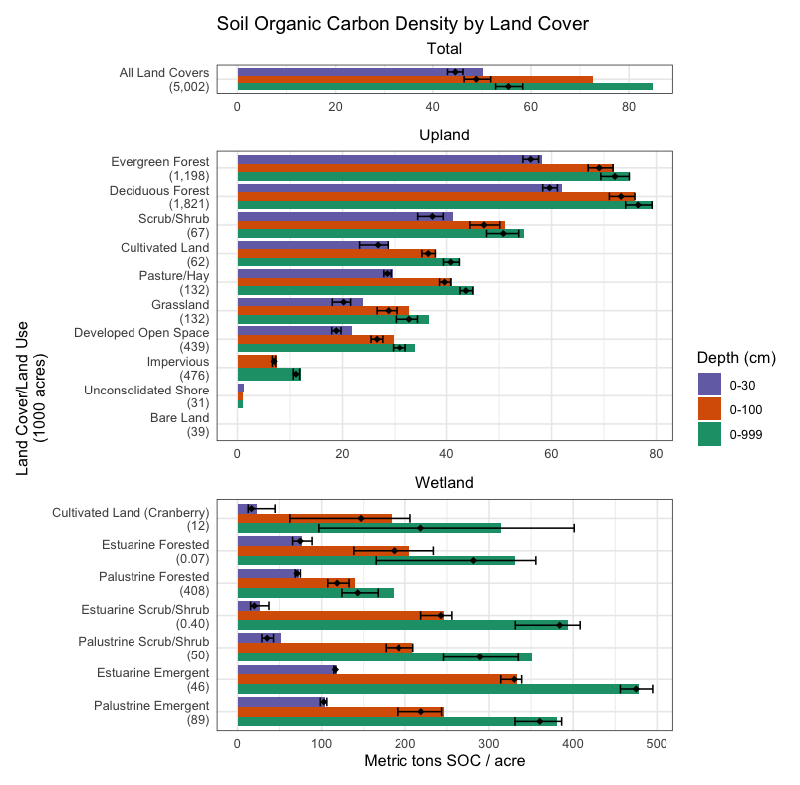
One of the clearest findings in the data involves wetlands. Though they cover only about 12% of Massachusetts’ land area, wetlands store roughly 35% of the state’s soil carbon. Some wetland soils hold over 300 metric tons of carbon per acre, compared to 74–78 for typical forests. Their carbon dynamics are complex enough that the conversion table doesn’t include wetland land covers; they require separate consideration.
The data also highlights how much carbon lies deeper than the top foot of soil. At the state level, 44% of soil organic carbon is stored below 30 centimeters, meaning measurements that only look at the surface layer miss nearly half the picture.
Who It’s For and What Comes Next
Bas described the state as “really excited” about using SOCMA for carbon calculations and climate scenario planning. Municipal planners can use it to identify where development would have the least carbon impact and where conservation or restoration could have the most. Farmers and land managers can get a better sense of the carbon dynamics of their specific soils.
RDG is currently working with EEA and MassGIS to make these data layers available through state mapping platforms over the coming year.
We’re also thinking about where this work could go next, including exploring machine learning approaches that better capture soil carbon as the continuous gradient it is.
“Our dream long-term,” Bas says, “is something that covers the entire United States, or at least the Northeast, and to be able to incorporate it into carbon accounting software.”
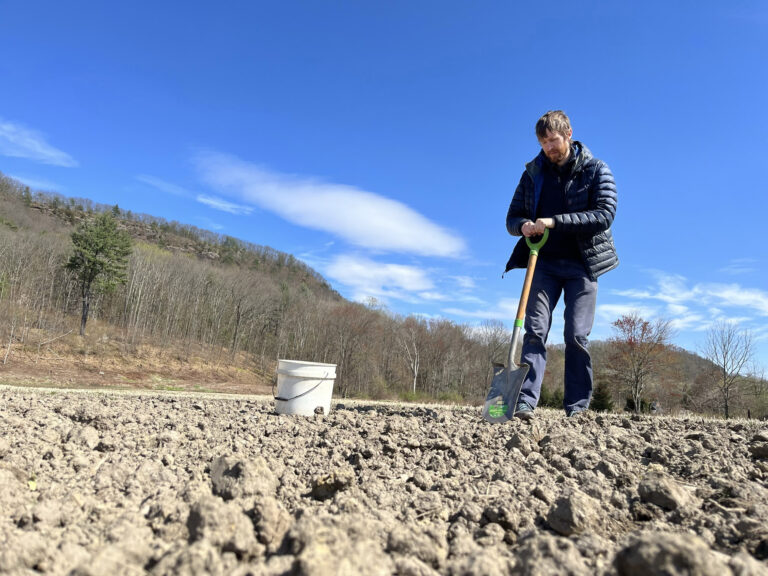
In the meantime, the team is seeking feedback, particularly from people conducting soil sampling. If you have field measurements and want to compare them with SOCMA’s estimates, we want to hear from you.
The data is currently available at masshealthysoils.org/socma.